Plant Material and Sampling Design
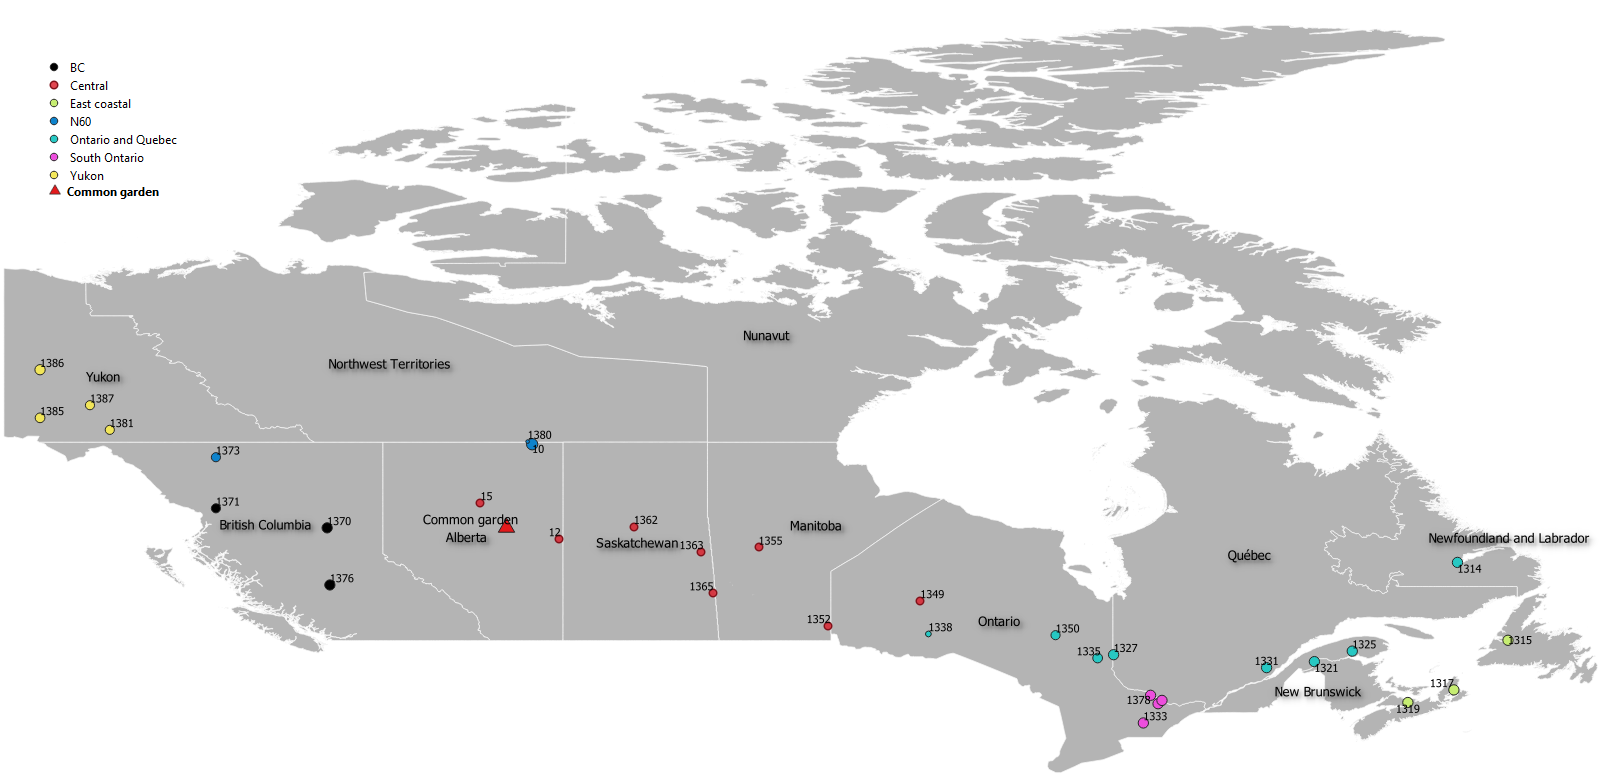
The tree rings used in this study were sourced from seven regions and 43 provenances across Canada. Long term data was collected from trees planted in May, 1982, at Calling Lake Experimental Area located at (55°17’N, 113°09’W, 625 m ASL).; Seed sources have been grouped into regions by geographical location, with each region containing two to four sites. Total number of trees planted from each region varied from 100 to 185. Other seeds from the original seed sources were planted in the summer of 2017. White spruce seedlings from 43 provenances across Canada were planted at a common garden trial near Calling Lake, Alberta, (55°17’N, 113°09’W, 625m ASL). Planting stock were sources from containerized seedlings that germinated in 1978 and were planted in 1982. Randomized complete block design was used for this field trial. It consisted of 5 blocks, 5 tree row plots with 2.5 x 2.5 m spacing. In order to reduce edge effects, two border rows were planted. Survival and tree height were assessed at age 32 and at age 27 the diameter at breast height (DBH), approx. 1.3 m above the ground was measured. (5 blocks × 33 provenances = 165 trees in total).(Sang et al., 2019) Analysis of 13C isotope ratio (δ13C) were carried out on the tree cores at the Natural Resources Analytical Laboratory (NRAL), University of Alberta isotope analysis was conducted using a ThermoFinnigan Delta+ Advantage Continuous Flow Isotope Ratio Mass Spectrometer by Thermo Finnigan Corp. Samples were ground in a ball mill and weighed before analysis. The intrinsic water-use efficiency (iWUE) is described in units of μmol CO2 mol−1 H2O and calculated as Farquhar and Sharkey (1982)
iWUE=A/gs=ca×[(1-ci/ca)/1.6]
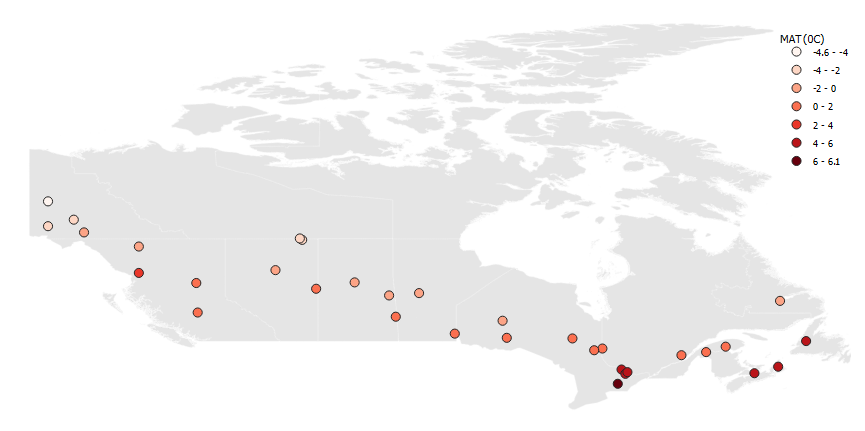
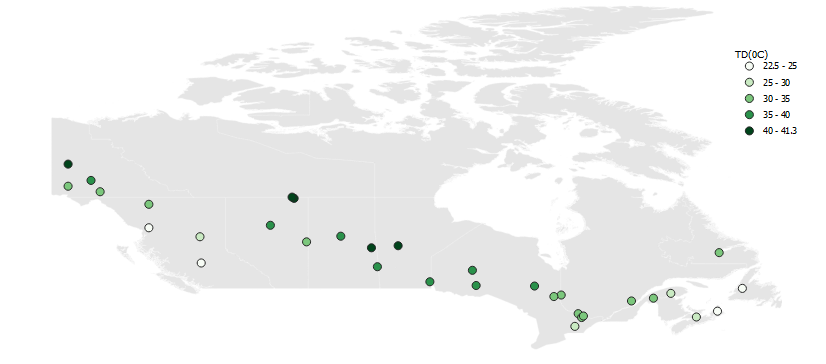
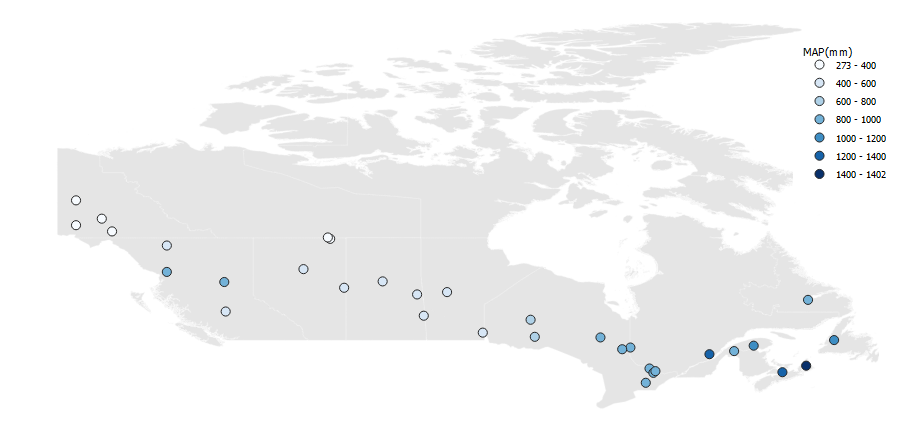
where A is the rate of net photosynthesis, gs is the rate of leaf stomatal conductance, and where Ca is the atmospheric CO2 concentration, and Ci is the leaf intercellular CO2 concentration. A map of the climatic and geographic characteristics of the study area was produced using QGIS 3.16 (Figure 4)
iWUE=A/gs=ca×[(1-ci/ca)/1.6]
where A is the rate of net photosynthesis, gs is the rate of leaf stomatal conductance, and where Ca is the atmospheric CO2 concentration, and Ci is the leaf intercellular CO2 concentration. A map of the climatic and geographic characteristics of the study area was produced using QGIS 3.16 (Figure 4)
A
|
B
|
C
|
D
|
Figure 4: Provenances varied greatly in both Mean Annual Temperature MAT(ºC) and Mean Annual Precipitation MAP(mm) as well as Temperature difference which is a measure of continentality TD(ºC). Yukon provenances were the coldest and driest while Southern Ontario provenances were warmer and wetter than most other provenances.
Disclaimer: Part of the data used in this study were fabricated for RENR 580
References
Farquhar, G. D., & Sharkey, T. D. (1982). Stomatal conductance and photosynthesis. Annual review of plant physiology, 33(1), 317-345.
Sang, Z., Sebastian‐Azcona, J., Hamann, A., Menzel, A., & Hacke, U. (2019). Adaptive limitations of white spruce populations to drought imply vulnerability to climate change in its western range. Evolutionary applications, 12(9), 1850-1860.
