Analysis of Growth increments
The growth increment analysis shows a similar pattern for height and DBH. The analysis revealed that the height of the trees at 32 years of age was significantly different for all the provenances. Provenances within Central Alberta showed the highest Diameter and breast height and average height. This is likely because it is closeness to the common garden and is expected to be familiar with the environmental characteristics of the region. This result is consistent with good fitness and high growth rates that are envisioned for sources in a locality (Sang et al., 2019) .Northern Alberta also expressed a lesser height contrary to the expectation even though they were considered local due to close proximity to the common garden. It is possible that due to the genetic make-up of some populations, they may not be able to take advantage of moister environments even though they would benefit from it. Southern Ontario and Quebec similarly showed better growth although they were not considered local. Yukon provenances had the lowest growth rate in DBH and height despite having a high survival rate, mostly because they were farthest from common garden and likely due to their short growing season in the cold and dry climate of their provenance of origin. Provenances in BC had a high variability in growth rate and survival within the region mostly attributed to the diverse geoclimatic zones. In general the survival rates were found to correlate positively with growth in all the provenances except Yukon. This significantly low growth in Yukon (see figure 14-17) may be attributed to longer growing season in the common garden, as Yukon trees usually have short growing season (Sebastian-Azcona et al. 2019).
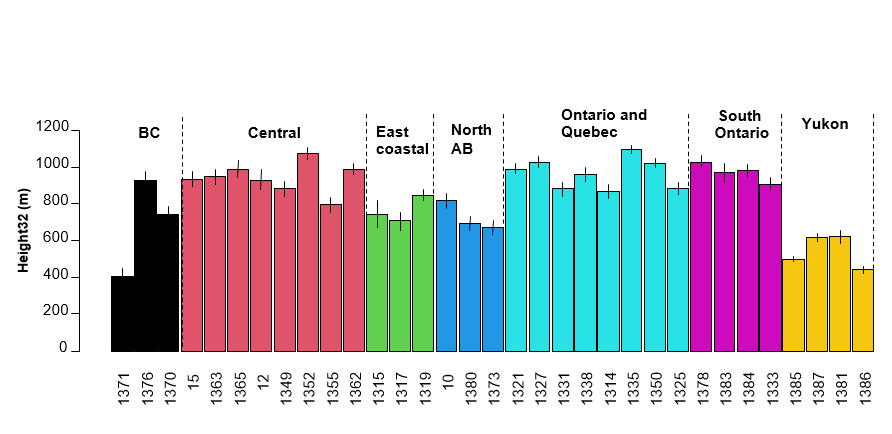
Figure 14: Average height of individuals within each region at 32 years.

Figure 16 : Survival rate of seedlings
|
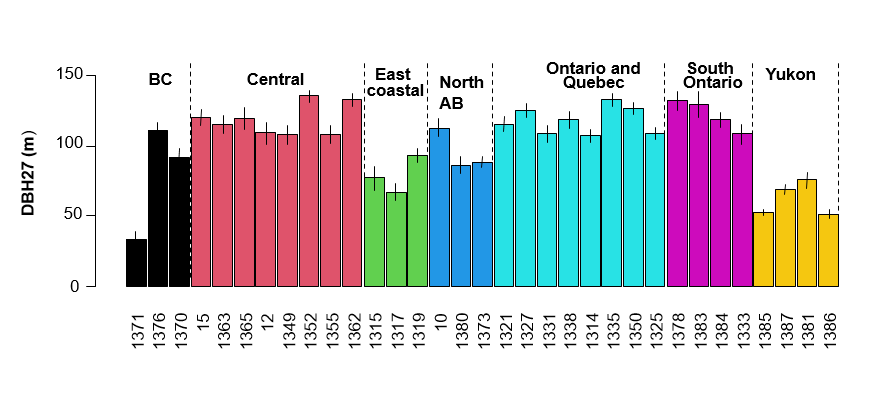
Figure 15 : Average DBH of individuals within each region at 32 years
Figure 17: Significant differences between height, DBH and survival of trees across the regions indicated by letters a, b, c and d . Error bars represent standard error of the mean.
|
Correlations between growth and climate
 Figure 18: Mean Mean annual precipitation and mean annual across the regions.
Point size have been adjusted to show growth increments.
Figure 18: Mean Mean annual precipitation and mean annual across the regions.
Point size have been adjusted to show growth increments.
The climate of the common garden is quite warm and moist and the provenances surrounding the common garden exhibited the best growth increment (Figure 18). Central Alberta, Ontario and Quebec showed good growth record as they have similar climate to the common garden, East coastal region and southern Ontario showed lesser growth rate which can be attributed to difference in the climate of the common garden and the climatic conditions of their provenance origins. BC again exhibited high variability in climate and consequently growth. Provenances in Yukon had inferior growth capabilities attributed to their inability to cope with the warm and moist conditions of the common garden. We can therefore infer they may not be able to tolerate drought stress.
Analysis of water use efficiency
WeiweWater use efficiency was significantly different within the regions, BC, South Ontario and Northern Alberta exhibited a higher water use efficiency under drought conditions, In contrast Central, Ontario and Quebec and Yukon provenances showed lower water use efficiency in dry situations. However, there was relatively no change in WUE in Yukon (Figure 19). This result when paired with data suggests that provenances in colder and drier regions may provide reforestation stock that be more drought resistant and consequently suitable for reforestation in the face of climate change.
The results of the change in water use efficiency clearly indicates that provenances from warm and wet climate will be able to adapt more to the expected increase in temperatures than those from a colder and drier climate (Figure 20). Change in water use efficiency fairly correlates positively with growth as observed in our results. We may therefore expect increase in growth rate to be associated with increase in water use efficiencies ((Weiwei et al., 2018). Although many studies have also observed a negative correlation between WUE and growth Dietrich et al.,2016; Nock et al., 2011; Lévesque et al.,2014)
The results of the change in water use efficiency clearly indicates that provenances from warm and wet climate will be able to adapt more to the expected increase in temperatures than those from a colder and drier climate (Figure 20). Change in water use efficiency fairly correlates positively with growth as observed in our results. We may therefore expect increase in growth rate to be associated with increase in water use efficiencies ((Weiwei et al., 2018). Although many studies have also observed a negative correlation between WUE and growth Dietrich et al.,2016; Nock et al., 2011; Lévesque et al.,2014)
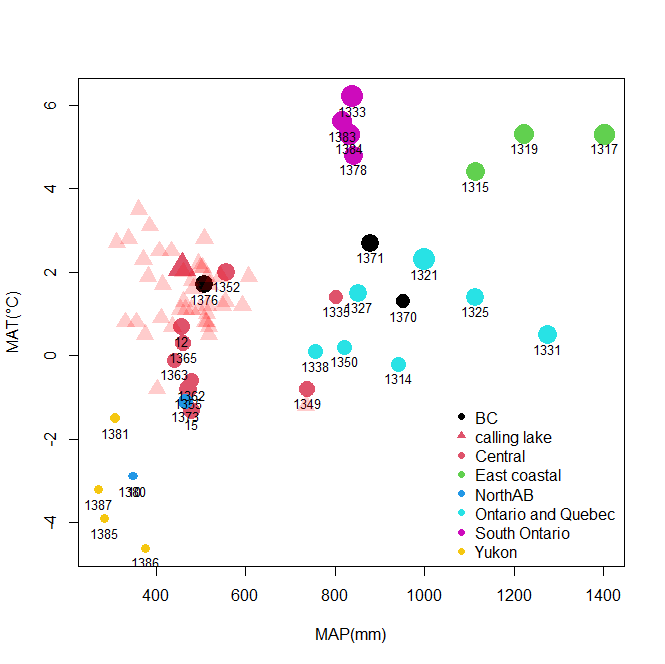
Figure 20: Δ water use efficiency derived from the difference between the dry and control WUE. The values are represented by the size of the points.
|
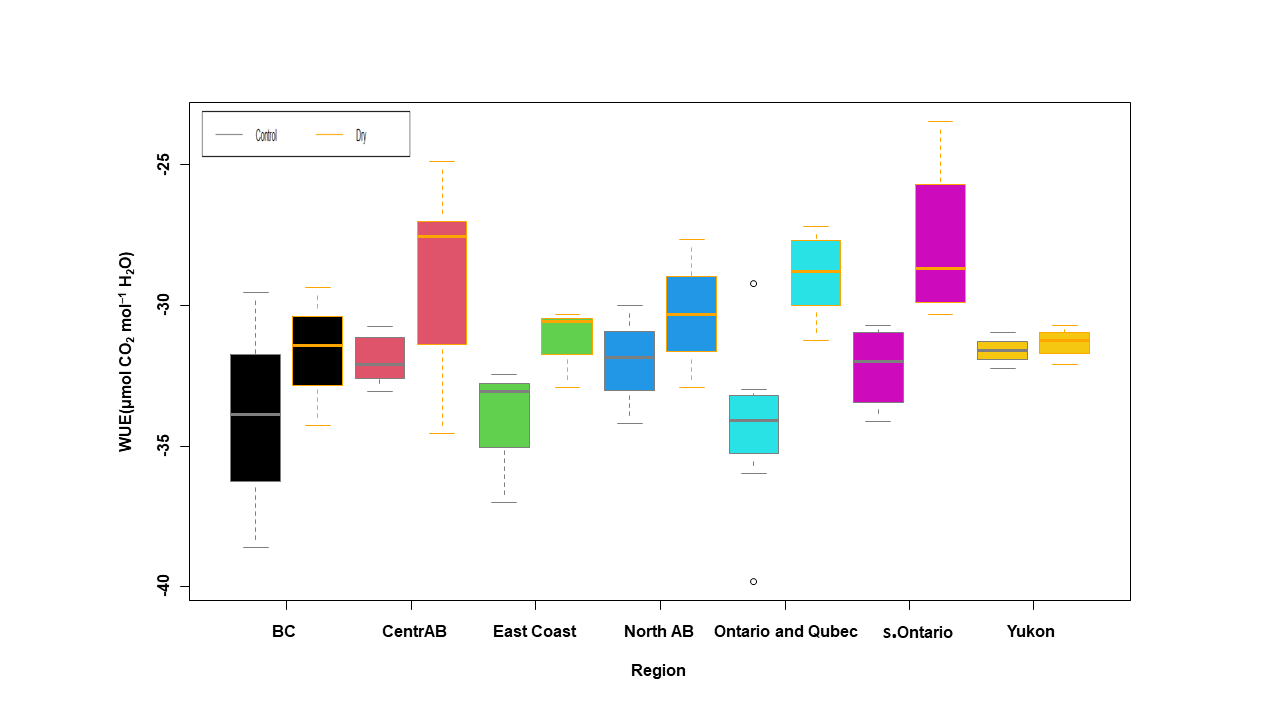
Figure 19: box plot showing water use efficiencies across the regions.
|
Disclaimer: Part of the data used in this study were fabricated for RENR 580
References
Sang, Z., Sebastian‐Azcona, J., Hamann, A., Menzel, A., & Hacke, U. (2019). Adaptive limitations of white spruce populations to drought imply vulnerability to climate change in its western range. Evolutionary applications, 12(9), 1850-1860.
Weiwei, L. U., Xinxiao, Y. U., Guodong, J. I. A., Hanzhi, L. I., & Ziqiang, L. I. U. (2018). Responses of intrinsic water-use efficiency and tree growth to climate change in semi-arid areas of North China. Scientific reports, 8(1), 1-10.
Lévesque, M., Siegwolf, R., Saurer, M., Eilmann, B., & Rigling, A. (2014). Increased water‐use efficiency does not lead to enhanced tree growth under xeric and mesic conditions. New Phytologist, 203(1), 94-109.
ock, C. A., Baker, P. J., Wanek, W., Leis, A., Grabner, M., Bunyavejchewin, S., & Hietz, P. (2011). Long‐term increases in intrinsic water‐use efficiency do not lead to increased stem growth in a tropical monsoon forest in western Thailand. Global Change Biology, 17(2), 1049-1063.
